 This work is licensed under a Creative Commons "Attribution 4.0 International" license.
This work is licensed under a Creative Commons "Attribution 4.0 International" license.
Linked Data is an increasingly common way to publish structured data in the Humanities (Boer et al. 2014; Meroño-Peñuela et al. 2015; Thornton et al. 2017). As Tim Berners-Lee, the "creator" of the Semantic Web, described - Linked Data “provides a common framework that allows data to be shared and reused across application, enterprise, and community boundaries.” ((W3C) 2011). Thus facilitating accessibility of knowledge on historical and cultural objects in a format readable by both humans and machines. For example, through standards such as the Resource Description Framework (RDF), natural language statements such as “George Orwell wrote 1984” can be expressed as a triple consisting of: a subject (:George_Orwell), a predicate (:wrote), and an object (:1984). This knowledge can be retrieved by machines through a unique and global identifier (Uniform Resource Identifiers - URIs). This affords a networked archive, bringing together publicly available materials distributed in libraries, archives and museums; and thus allowing the researcher to integrate, and implement an unprecedented amount of often unstructured, siloed data, in lightning speed. Such an ontology or data model affords access, merging of information, and enrichment through efficiently linking of information on objects, entities and relations of collections to other collections.
Technically speaking data represented in the RDF language is structurally a graph. Thus it inherently allows us to infer relations, bundling any common affiliation between objects and attributes. From a research point of view this has led to a tendency to study RDF as a network. The study of networks and specifically the study of social networks has its roots in sociological theories where relationships form a part of the basis for understanding behavior(Simmel 1955; Durkheim 1951) where all actions are embedded in networks.(Granovetter 1985) These relations – a set of edges, between nodes (entities) – define a network. These social networks reflect types of relations (e.g., a friendship tie in a friendship network or advice tie in an advice network). The study of networks, and in particular social networks, have been and are on the rise, providing explanations for relational and systematic phenomena(Borgatti and Foster 2003), as it moves beyond explanations based on individual factors. For example not that someone’s age explains their success, but rather the structure of their social network.(Granovetter 1985)
The identification of networks is often thought of as a laborious task. It is traditionally done in many fields by searching through archival sources to identify nodes and edges, and reshaping data that is often not collected as relational, but from which one can infer relations. This entails integrating, and implementing a large amount of often unstructured, siloed and incomplete data to reconstruct relations between nodes and edges. Thus information about relations where a social network can be inferred from RDF provides a great advantage for exploring social networks embedded in this data. Networks can efficiently be reconstructed with the development of specific SPARQL queries to reflect different lenses of relations. For example, generating networks of different time periods, of different types of relations, with different boundaries (looking at relations of one city versus one country, or a neighborhood to a street) over the same data source.
Modeling data as networks affords the implementation of network analysis. Network analysis –the method used to analyze relations– provides a lens to investigate these diverse complex relational dynamics to examine structure, content or function. For social networks, which are the focus of the examples we provide in this paper, the structure of networks and positions of actors in these structures are seen as proxies for understanding social structure (Burt 1980; Coleman 1988).
The analysis of networks from RDF is largely done with a pipeline of tools (i.e. (Groth and Gil 2011; Gil and Groth 2011)). This starts with a data source, and the tools necessary for querying the specific data and relations. For example one workflow may be: the Wikidata Query Service, which allows one to query linked data in the Wikisphere through a SPARQL query, and can be exported in a number of formats; or the data might be stored in a database and is extract-able as a JSON(-LD) file. Moving from these file types, this relational data needs to converted into a file type that is readable by a network analysis software. Typical network analysis software use a range of inputs depending on the program. The two most commonly used user friendly network analysis and visualization programs with a graphic user interface are Gephi1 and UCINet2. These programs allow the implementation of various types of input files; for example: .csvs, matrices and DL files, as well as program specific files. Then pending the required analysis there are a number of export options to further reuse these results as data. This, for example, could include analysing network measures and considering them as a variable in a statistical model in a program such as SPSS, or R. Thus the current workflow approaches for working with network data from RDF requires researchers to work through multiple programs to specify queries, extract networks and export data as matrices, and implement network analysis tools to investigate graphs.
In addition, in building such a pipeline we lose sight of the hermeneutics of the research objects.(Gibbs and Owens 2013) Researchers are often faced with black boxed tools that limit their understanding of the projection, generation, analysis or reformatting that occurs with each step. With each use of an additional program, algorithm or command, the data gets re-"massaged" and shaped. This further becomes an issue, when the development of such a pipeline is a technical adversary for domain experts (e.g. historians, literary scholars) with (traditionally) limited technical knowledge; but also for researchers with specific expertise in RDF or networks. Thus, we argue there is a need, within the DH community, to reduce this RDF-to-network analysis pipeline without creating another domain or research question specific tool, and while maintaining oversight over the process from RDF-to graph-to network analysis.
To address these issues, we propose the use of a Jupyter notebook that integrates the Python packages: RDFLib3 with NetworkX4.5 This results in a reusable workflow that allows network analyses over RDF data to be more accessible, flexible, transparent and iterative. This is due to that increases the reliability in exploring all the possible social networks within the available RDF, as well as increases the speed, ease, and efficiency of the necessary steps of RDF to network analysis. What specifically sets our work apart from previous workflows is its flexibility in quickly re-running network analyses over slightly modified RDF graphs, while maintaining the code visible for transparency and learning. We outline this pipeline through two case studies:
a case of the social networks of 19th century women editors in Europe available on Wikidata, and
provenance of the harmonization of the historical Dutch censuses (1795-1971)
to explain how it can be useful for humanities research.
The notebook consists of five “cells”, which are actionable code blocks, shown here in Figure 1. The output of all these processes can be selected and copy-pasted for further reuse in graph processing frameworks or directly in reports or papers.
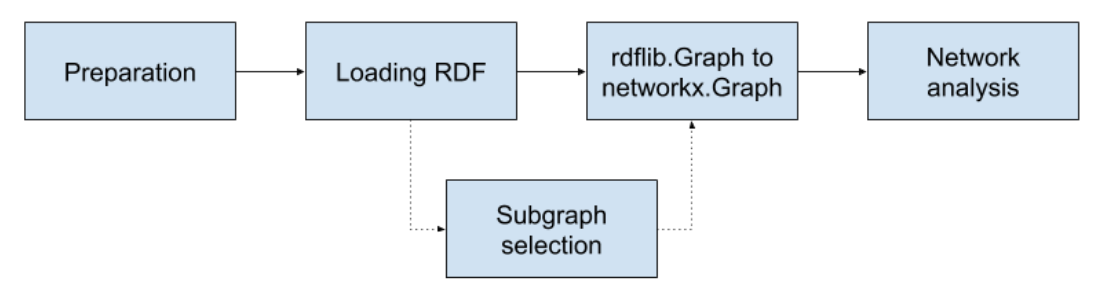
As a first step the notebook loads the relevant packages - RDFLib and NetworkX. RDFLib is a Python package for working with RDF that includes parsers and serializers for RDF/XML, N3, NTriples, N-Quads, Turtle, TriX, RDFa and Microdata; a graph interface; store implementations for in memory storage and persistent storage on top of the Berkeley DB; and a SPARQL 1.1 implementation (Krech 2006). This facilitates a flexible environment for loading and manipulating RDF graphs. Then the user is prompted to input the full path to an RDF graph to load the RDF graphs. This can be any local or online RDF file.
Users select a specific network in the RDF graph. The efficient aggregation of different snapshots of the networks can be achieved through a SPARQL query. SPARQL is a Semantic Web query language for databases which enable the ability to retrieve and manipulate data RDF specifically (Segaran, Evans, and Taylor 2009).
In order to generate a network, this RDF needs to converted into a matrix. This is accomplished through a conversion of RDFLib.Graph to NetworkX.Graph. This prepares a file of the identified graph for analysis in NetworkX.
The Python library NetworkX enables the analysis of networks of around 10 million nodes and 100 million edges.(Hagberg and Conway 2010) It is ideal for use for digital humanities as it affords the use of many types of networks, including directed graphs, and graphs with and self loops; while not maintaining strict object functions.(Hagberg, Swart, and S Chult 2008) This implies that in the case of RDF which may have many and multiple types of networks embedded in the triples it will model anything that is structured as a matrices. This could include networks that we do not discuss here in this paper such as affiliation or two-mode networks, semantic networks and so forth. Thus the tool, which operates in the more general space of RDF models, does not limit the boundaries of inspection by imposing specific network models, leaving this choice to the user.
Networks can be represented as graphs where positions and structures are systematically analyzed.(Wasserman, Faust, and others 1994) These principles originate from graph theory, which provides mathematical descriptions of characteristics.(Van Steen 2010)
The networks can then be analyzed in NetworkX considering a number of characteristics of the network, as well as statistical analyses, see Table 1. Proposed Network Characteristics. We have selected a standard, non-exhaustive, set of one-mode complete network measures. This is to establish the proof of concept, of course in practice any network measure that is included in NetworkX could be implement in this notebook, for example measures of community detection, to other measures of centrality. For a more exhaustive list and explanation of network measures see (Wasserman, Faust, and others 1994).
Following this selection the network analysis is run and the results are printed, as well as a basic visualization which serves for the researcher to confirm a first accuracy check of the network, e.g. were the correct node and edges selected?; does something look strange or potentially missed in the query?, that can now be amended.
| Network Concepts | Network measures |
|---|---|
| network size | total number of nodes, and the average number of edges |
| power centrality | nodal position: e.g. degree centrality, betweenness, and eigenvector centrality (Freeman 1978) |
| density | a value of the proportion of all possible ties that are present |
In this Section we validate our approach using two different case studies for the Digital Humanities: the social networks of women editors in Europe in the 19th century; and the provenance graphs of harmonization transformations performed in the Dutch historical censuses. The use of these cases are to demonstrate the use of the notebook, not a network study with elaborated research questions and operationalized network measures.
The 19th century in Europe, was one of the onset and rise of industrialization, altered the socioeconomic and cultural norms influencing the movement of people through advancements in train infrastructure and technologies in food and consumer goods, and investments in education throughout Europe. This also led to an increasing advancement of women’s rights and positions in society. The ERC “Agents of Change: Women Editors and Socio-Cultural Transformation in Europe, 1710-1920” (acronym WeChangEd) directed by Marianne Van Remoortel and based at the Department of Literary Studies, Ghent University, Belgium (Agents of Change: Women Editors and Socio-Cultural Transformation in Europe 2015), questioned how the press and periodical editorship in particular enabled women to take a prominent role in public life, to influence public opinion and to shape transnational processes of change. To facilitate the collection of biographical records, and archival evidence of women editors in Europe a Linked Data model was developed (Schelstraete and Van Remoortel 2019). This model afforded the cataloguing and tracing of different social networks in which the women participated.
This resulted in a large and growing database which includes 1700+ persons, 1600+ periodicals and 200+ organizations, as well as biographical information of these entities and relations between them, as identified through archival research. This data is available as the WCD Database, as subsets of data stored as .csv (Van Remoortel 2020). In April 2020, the WCD database was imported to Wikidata (Thornton et al., n.d.) to facilitate the reuse and integration of this information with other Linked Open Data sources. The WeChangEd data can be identified in Wikidata through the unique property instance of WeChangEd ID P7947, see - https://www.wikidata.org/wiki/Property:P7947. This resulted in 3661 instances of data which compromises people, periodicals, organizations, as well as records of the relationships between these three entities, biographical information about these instances, and so forth. The complete dataset can be found via a Wikidata Query Service via - https://w.wiki/QiQ.
Identifying historical social networks is a laborious task, thus having the information on relations in Wikidata, and specifically as RDF, allows the researcher to explore historical social networks of the past in a more valid and flexible manner. The validity is increased, as the information is shared with the community, where it can be cross-checked, questioned, and enriched through the edit functions of Wikidata. As we show here through this example, the flexibility is affording by this pipeline.
In exploring how a researcher can identify social networks of these editors we display here three examples of projecting personal relationships of female editors between individuals as identified within the WeChangEd dataset. To identify these relationships we developed three SPARQL queries for the Wikidata Query Service, which we detail here below, and are also available at: https://w.wiki/Qtr, https://w.wiki/QiQ, and https://w.wiki/QcS, respectively. Using these graphs as input for the method described in Section 2, we convert these graphs to a NetworkX file and the network analysis is executed. We implement this query in the notebook resulting in three different network projections, and reflect on the implications for digital humanities researchers in compiling social networks from the past.
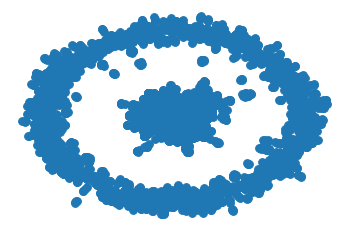
The first network represents a query on the entire WCD dataset, to identify kinship relations, this includes any identified siblings, parents, unmarried partner, spouse, or children of female editors https://w.wiki/Qtr (see Listing 1).
SELECT DISTINCT ?item ?o ?itemLabel ?sibling ?spouse ?partner ?father ?mother ?child
WHERE

{
# find occupation editors
?item wdt:P106 wd:Q1607826.
?item wdt:P7947 ?o .

# that are female
?item wdt:P21 wd:Q6581072.

# that have a birth and death date
?item wdt:P569 ?birthDate.
?item wdt:P570 ?deathDate .

# with kinship: sibling
OPTIONAL { ?item wdt:P3373 ?sibling .}
# with kinship: spouse
OPTIONAL { ?item wdt:P26 ?spouse .}
# with kinship: unmarried partner
OPTIONAL { ?item wdt:P451 ?partner .}

# with kinship: father
OPTIONAL { ?item wdt:P22 ?father .}
# with kinship: mother
OPTIONAL { ?item wdt:P25 ?mother .}
# with kinship: child
OPTIONAL { ?item wdt:P40 ?child .}

# labels
SERVICE wikibase:label { bd:serviceParam wikibase:language
"[AUTO_LANGUAGE],en". }

} ORDER BY ?birthDate ?deathDateThis results in a network of all female editors and their relationships as identified in Wikidata, where nodes are individuals and edges or ties of represent a personal relationship, see Figure 2.
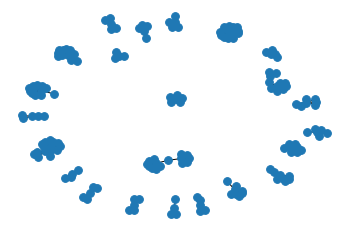
In this second selection we aim to show, how to refine the query, to select a more bounded set of nodes. This is a bounded selection of relations from within the WCD dataset but specifically of 19th century British female editors and their kinship relations, this includes any identified siblings, parents, unmarried partner, spouse, or children: https://w.wiki/QnA (see Listing 2).
SELECT DISTINCT ?item ?o ?itemLabel ?sibling ?spouse ?partner ?father ?mother ?child
WHERE

{
# find occupation editors
?item wdt:P106 wd:Q1607826.
?item wdt:P7947 ?o .

# that are female
?item wdt:P21 wd:Q6581072.

# that have a birth and death date
?item wdt:P569 ?birthDate.
?item wdt:P570 ?deathDate.

 # that is British
?item wdt:P27 wd:Q174193.

# with kinship: sibling
OPTIONAL { ?item wdt:P3373 ?sibling .}
# with kinship: spouse
OPTIONAL { ?item wdt:P26 ?spouse .}
# with kinship: unmarried partner
OPTIONAL { ?item wdt:P451 ?partner .}

# with kinship: father
OPTIONAL { ?item wdt:P22 ?father .}
# with kinship: mother
OPTIONAL { ?item wdt:P25 ?mother .}
# with kinship: child
OPTIONAL { ?item wdt:P40 ?child .}

# only active in the 19th century
FILTER ( ?birthDate >= "1800-01-01T00:00:00Z"^^xsd:dateTime &&
?deathDate <= "1898-12-31T00:00:00Z"^^xsd:dateTime )

# labels
SERVICE wikibase:label { bd:serviceParam wikibase:language
"[AUTO_LANGUAGE],en". }

} ORDER BY ?birthDate ?deathDateThis results in a network of the personal relations of 19th century British female editors, where nodes are individuals and edges are relationships, see Figure 3. This network is a subset of the larger graph, but with parameters of time - editors living during the 19th century, and place -what was then the United Kingdom of Great Britain and Ireland.
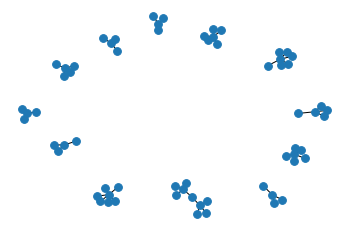
The third case, aims to represent a different subset of the data, that is looking at relationships between editors based on language, instead of a geographical or political space. This selection represents a query of 19th century German speaking female editors and their kinship relations, this includes any identified siblings, parents, unmarried partner, spouse, or children:- https://w.wiki/QnB (see Listing 3).
SELECT DISTINCT ?item ?o ?itemLabel  ?sibling ?spouse ?partner ?father ?mother ?child
WHERE

{
# find occupation editors
?item wdt:P106 wd:Q1607826.
?item wdt:P7947 ?o .

# that are female
?item wdt:P21 wd:Q6581072.

# that have a birth and death date
?item wdt:P569 ?birthDate.
?item wdt:P570 ?deathDate.

# that speaks German
?item wdt:P1412 wd:Q188.

# with kinship: sibling
OPTIONAL { ?item wdt:P3373 ?sibling .}
# with kinship: spouse
OPTIONAL { ?item wdt:P26 ?spouse .}

# with kinship: father
OPTIONAL { ?item wdt:P22 ?father .}
# with kinship: mother
OPTIONAL { ?item wdt:P25 ?mother .}
# with kinship: child
OPTIONAL { ?item wdt:P40 ?child .}

# only active in the 19th century
FILTER ( ?birthDate >= "1800-01-01T00:00:00Z"^^xsd:dateTime &&
?deathDate <= "1898-12-31T00:00:00Z"^^xsd:dateTime )

# labels
SERVICE wikibase:label { bd:serviceParam wikibase:language
"[AUTO_LANGUAGE],en". }

} ORDER BY ?birthDate ?deathDateThis results in a network of relations of German speaking female editors as identified on Wikidata. Selecting German speaking instead of a specific empires and or nation-state provides a broader query for identifying possible interactions between the German-speaking community in the 19th century. This results in a network of individuals as nodes and edges as relations, see Figure 4.
The complete results for two specific social networks of 19th century British female editors and 19th century German speaking female editors can be found in detail in the appendix. The results show the network analysis on connected components or groups of connected individuals, most central nodes, and communities. A researcher can use these results, combined with the visualizations to further explore these relations either returning to archival materials to investigate previously understudied relations, or further analyse the structure and positions within these network to explain social capital of the periodicals the editors edited or kinship relations.
These three examples from within the WCD dataset on Wikidata display the flexibility of this approach in moving through a dataset, to generate social networks. This notebook, in contrast to other workflows allows researchers to consider aspects of space, time, place and other parameters of the data within a few steps and seconds; where the researcher can move and back and forth between the raw data, the query, the network projection, and the analysis, to compile the most suitable, reliable graph from the available data. It serves as both an efficient approach to explore the social relations within a dataset, as well as to validly and reliably generate a social network and conduct social network analysis of the networks from RDF.
The Dutch historical censuses were collected in the Netherlands in the period 1795–1971, in 17 different editions, once every 10 years. The government counted all the country’s population, door-to-door, and aggregated the results in three different census types: demographic (age, gender, marital status, location, belief), occupational (occupation, occupation segment, position within the occupation), and housing (ships, private houses, government buildings, occupied status). After 1971, this exhaustive collection stopped due to social opposition, and the government switched to municipal registers and sampling (Ashkpour, Meroño-Peñuela, and Mandemakers 2015). Various projects have digitized the resulting census data (CBS; IISH; Data Archiving and Networked Services6, DANS; and the Netherlands Interdisciplinary Demographic Institute7, NIDI), and have manually translated them into a collection of 507 Excel spreadsheets and 2,288 census tables.8. The CEDAR project9 takes these spreadsheets as input, and produces a Knowledge Graph of 6.8 million statistical observations (Meroño-Peñuela et al. 2015) many of which went through an harmonization process to satisfy the standardization needs of historians for their querying (Ashkpour, Meroño-Peñuela, and Mandemakers 2015).
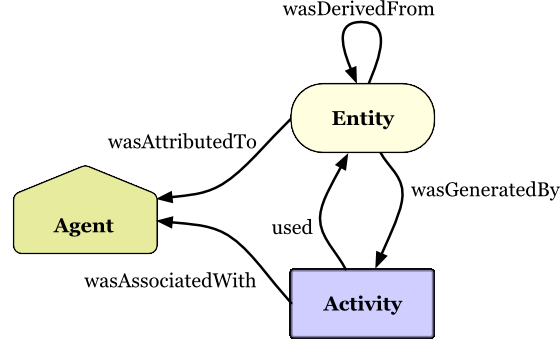
In this case study, we use the CEDAR Knowledge Graph (Meroño-Peñuela et al. 2015) with our proposed approach to explain how to a researcher can consider network similarities and differences between various historical census data points and their provenance information. Historians are particularly interested in the transformation and manipulations that occurred in this harmonization process in generating these data points; as this signals their correctness and hence its reliability. Fortunately, the CEDAR Knowledge Graph documents the harmonization transformations of all data points using the W3C PROV standard (Lebo et al. 2013). This standard models provenance as the interactions between various entities (the objects subject to transformations, i.e. the census data points), activities (the transformation processes themselves, i.e. the harmonization rules) and agents (the persons or programs commanding the transformations) as shown in Figure 5.
We select two arbitrary observations of the census, VT_1859_01_H1-S8-J647-h (observation 1, \(o_1\)) and VT_1920_01_T-S0-R10108-h (observation 2, \(o_2\)), and their corresponding provenance traces with the query shown in Listing 4 against the CEDAR SPARQL endpoint10. We use the graphs returned by this query as input for the notebook.11
CONSTRUCT {
 ?obs ?obs_p ?obs_o .
 ?act ?act_p ?act_o .
} WHERE {
 VALUES ?obs {:VT_1859_01_H1-S8-J647-h :VT_1920_01_T-S0-R10108-h}
 ?obs prov:wasGeneratedBy ?act .
 ?obs ?obs_p ?obs_o .
 ?act ?act_p ?act_o .
}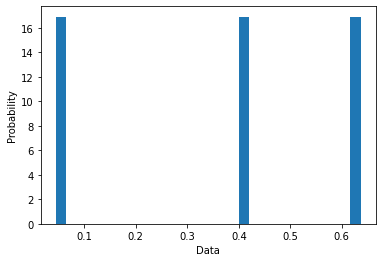
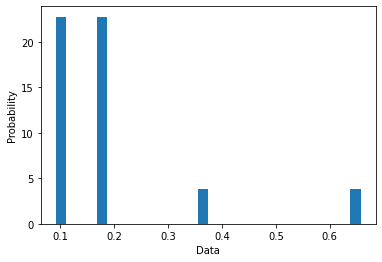
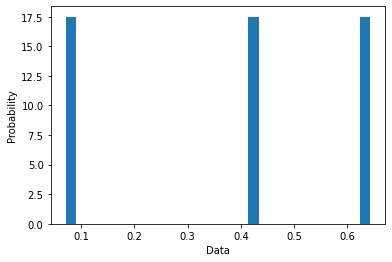
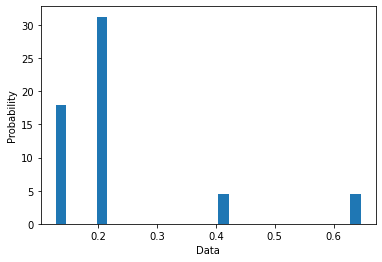
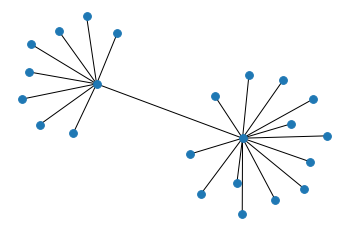
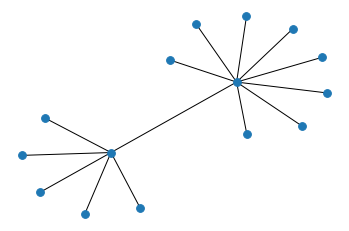
We use the provenance graphs of \(o_1\) and \(o_2\) as input for the method described in Section 2. We execute the preparation block; we use the query of Listing 4 as subgraph selection; we execute the network conversion block; and finally we execute the network analysis block. The output networks as plotted by the notebook are shown in Figure 7. We can observe that for both cases the network is 2-star shaped, with the nodes representing the observation and the activity at the center of these stars and various nodes describing their properties, as expected. One edge (prov:wasGeneratedBy) connects these two nodes. An noticeable difference is that while \(o_1\) (Fig. 7a) is transformed by 6 different harmonization rules, \(o_2\) (Fig. 7b) is only affected by 3. This can provide interesting insights for historians, who may be keen to examine statistical observations that have been subject to a higher number of transformations (and therefore more prone to errors) and the relations of these transformations to their immediate context. In this sense, visualizing these network contexts can be a powerful tool for interpretation.
Additionally, Figure 6a-d shows the histograms for degree and eigenvector centrality drawn by the notebook for both graphs. This is a more aggregated view on the networks, showing similar behaviour for \(o_1\) and \(o_2\) (due to the structural similarity of provenance graphs) but also interesting differences. For example, \(o_1\) eigenvector centrality shows a more normal distribution due to the higher variety of node influence in a more varied network. The remaining network statistics can be found upon the execution of these two examples in the notebook at https://github.com/descepolo/rdf- network-analysis/blob/master/rdf-network-analysis.ipynb.
In this paper we have detailed how we have proposed to combine popular libraries in RDF data management and network analysis in one single, publicly accessible Jupyter Notebook that enables a structured approach to network analyses of RDF graphs. With the proposed Juypter notebook we have developed a transparent and iterative tool for RDF to network in research. The open code and user-friendliness of the notebook ensures flexibility for users in implementing different aspects of the two libraries that we did address here in this demonstration. In addition, we have demonstrated through the tool and use cases how this affords the reuse and accessibly for non-technical scholars of RDF, as well as increase the efficiency and flexibility of use for generating networks from RDF. This approach facilitates the study of diverse types of networks from RDF and thus study of relational phenomenon in the Humanities and beyond.
In addition, this approach proves, contrary to the trend in the digital humanities, that we do not need a new network software that converts diverse file types to make fundamental improvements on both the quality of the networks used in research, as well as the the analysis of networks. Rather, as we presented, a fundamental rethinking of how data on social networks is structured, manipulated and pushed through a pipeline is needed to efficiently generate, project and evaluate networks. This approach increases the flexibility, compared to traditional network workflows- where the analyst would prepare a matrix for each projection of a network, go back to source material every time to reshape the data and networks based on different periods, or parameters (e.g. variables such as country of birth, gender, language of entities), and push it through the workflow. Such an approach reduces the technical adversary of knowledge on RDF and network analysis, while avoiding a black boxed software, as well as retains a hermeneutic approach to the source data, allowing the researcher to iteratively and efficiently requery, reshape and reanalyze the networks embedded in RDF.
The authors would like to thank Prof. dr. Paul Groth for his feedback on this work but also for his ongoing support of all of our crazy ideas. The first author would like to thank her partner- Radboud Reijn for being so patient, and secondly the continued support from Prof. dr. Marianne Van Remoortel in proposing and believing in a DH project for periodical studies. The work of the first author was supported by the H2020 European Research Council under the ERC Starting Grant agreement no. 639668. This work has been partly supported by the Dutch national project CLARIAH.
Agents of Change: Women Editors, ERC project, and 1710-1920″ (acronym WeChangEd) Socio-Cultural Transformation in Europe. 2015. “WeChangEd.” Online https://www.wechanged.ugent.be/.
Ashkpour, Ashkan, Albert Meroño-Peñuela, and Kees Mandemakers. 2015. “The aggregate Dutch historical censuses: Harmonization and RDF.” Historical Methods: A Journal of Quantitative and Interdisciplinary History 48 (4): 230–45.
Boer, Victor de, Matthias van Rossum, Jurjen Leinenga, and Rik Hoekstra. 2014. “Dutch Ships and Sailors Linked Data.” In International Semantic Web Conference, 229–44. Springer.
Borgatti, Stephen P, and Pacey C Foster. 2003. “The Network Paradigm in Organizational Research: A Review and Typology.” Journal of Management 29 (6): 991–1013.
Burt, Ronald S. 1980. “Models of Network Structure.” Annual Review of Sociology 6 (1): 79–141.
Durkheim, Emile. 1951. “Suicide: A Study in Sociology (Ja Spaulding & G. Simpson, Trans.).” Glencoe, IL: Free Press.(Original Work Published 1897).
Freeman, Linton C. 1978. “Centrality in Social Networks Conceptual Clarification.” Social Networks 1 (3): 215–39.
Gibbs, Fred, and Trevor Owens. 2013. “The Hermeneutics of Data and Historical Writing.” Writing History in the Digital Age 159.
Gil, Yolanda, and Paul Groth. 2011. “LinkedDataLens: linked data as a network of networks.” In Proceedings of the Sixth International Conference on Knowledge Capture, 191–92. ACM.
Granovetter, Mark. 1985. “Economic Action and Social Structure: The Problem of Embeddedness.” American Journal of Sociology 91 (3): 481–510.
Groth, Paul, and Yolanda Gil. 2011. “Linked Data for Network Science.” In Proceedings of the First International Conference on Linked Science-Volume 783, 1–12. CEUR-WS. org.
Hagberg, A, and D Conway. 2010. “Hacking Social Networks Using the Python Programming Language.” Sunbelt 2010, Riva Del Garda, Italy.
Hagberg, Aric, Pieter Swart, and Daniel S Chult. 2008. “Exploring Network Structure, Dynamics, and Function Using Networkx.” Los Alamos National Lab.(LANL), Los Alamos, NM (United States).
Krech, D. 2006. “RDFlib: A Python Library for Working with Rdf.” Online https://github. com/RDFLib/rdflib.
Lebo, Timothy, Satya Sahoo, Deborah McGuinness, Khalid Belhajjame, James Cheney, David Corsar, Daniel Garijo, Stian Soiland-Reyes, Stephan Zednik, and Jun Zhao. 2013. “Prov-O: The Prov Ontology.” W3C Recommendation.
Meroño-Peñuela, Albert, Ashkan Ashkpour, Christophe Guéret, and Stefan Schlobach. 2015. “CEDAR: the Dutch Historical Censuses as Linked Open Data.” Semantic Web 8 (2): 297–310.
Schelstraete, Jasper, and Marianne Van Remoortel. 2019. “Towards a Sustainable and Collaborative Data Model for Periodical Studies.” Media History 25 (3): 336–54.
Segaran, Toby, Colin Evans, and Jamie Taylor. 2009. Programming the Semantic Web: Build Flexible Applications with Graph Data. " O’Reilly Media, Inc.".
Simmel, Georg. 1955. “The Web of Group-Affiliations. Conflict and the Web of Groupaffiliations.” New York: The Free Press.
Thornton, Katherine, Birkholz Julie M., Marianne Van Remoortel, and Seals-Nutt Kenneth. n.d. “Working Paper on Bringing to Light to Women Editors of the Past Through Linked Open Data on Wikidata.”
Thornton, Katherine, Euan Cochrane, Thomas Ledoux, Bertrand Caron, and Carl Wilson. 2017. “Modeling the Domain of Digital Preservation in Wikidata.” In Proceedings of Acm International Conference on Digital Preservation, Kyoto, Japan.
Van Remoortel, J. M., M.; Birkholz. 2020. “WeChangeD Database.” Online https://www.wechanged.ugent.be/wechanged-database/.
Van Steen, Maarten. 2010. “Graph Theory and Complex Networks.” An Introduction 144.
(W3C), World Wide Web Consortium. 2011. “W3C Semantic Web Activity.” Online https://www.w3.org/2001/sw/.
The full notebook is available at https://github.com/descepolo/rdf-network-analysis/blob/master/rdf-network-analysis.ipynb. A Google Colaboratory version of the notebook is also available, which makes it executable on the web with no need of local installation: https://colab.research.google.com/github/descepolo/rdf-network-analysis/blob/master/rdf-network-analysis.ipynb.↩︎
https://api.druid.datalegend.net/datasets/datalegend/CEDAR-S/services/CEDAR-S/sparql↩︎
The input graphs are also available at https://github.com/albertmeronyo/rdf-network-analysis/blob/master/uc1.nt and https://github.com/albertmeronyo/rdf-network-analysis/blob/master/uc2.nt↩︎